Displaying Complex Values in the Data Window
To explore complex data structures, you can Illegal HTML tag removed : display them permanently in the data window. The data window displays selected data of your program, showing complex data structures graphically. It is updated each time the program stops.
- Display Basics: How to create, manipulate, and delete displays.
- Arrays: Special functions for arrays.
- Assignment: Setting variable values.
- Examining Structures: Dereferencing pointers and other references.
- Customizing Displays: Data Themes.
- Layouting the Graph: Automatic layout.
- Printing the Graph: Printing on paper.
Node:Display Basics, Next:Arrays, Up:Displaying Values
Display Basics
This section discusses how to create, manipulate, and delete displays. The essentials are:
- Click on
Displayto display the variable in(). - Click on a display to select it.
Click on
Undisplayto delete the selected display.Creating Single Displays:
- Selecting Displays:
- Showing and Hiding Details:
- Rotating Displays:
- Displaying Local Variables:
- Displaying Program Status:
- Refreshing the Data Window:
- Placement:
- Clustering:
- Creating Multiple Displays:
- Editing all Displays:
- Deleting Displays:
Node:Creating Single Displays, Next:Selecting Displays, Up:Display Basics
Creating Single Displays
To create a new display showing a specific variable, select the variable by clicking mouse button 1 on its name. The variable name is copied to the argument field. By clicking the Display button, a new display is created in the data window. The data window opens automatically as soon as you create a display.

As a shorter alternative, you can simply press mouse button 3 on the variable name and select Display from the popup menu.
As an even faster alternative, you can also double-click on the variable name.
As another alternative, you may also enter the expression to be displayed in the argument field and press the Display button.
Finally, you may also type in a command at the debugger prompt:
     graph display

**Illegal HTML tag removed :** expr

 [clustered] [at (

**Illegal HTML tag removed :** x

,

**Illegal HTML tag removed :** y

)]
         [dependent on

**Illegal HTML tag removed :** display

] [[now or] when in

**Illegal HTML tag removed :** scope

]
This command creates a new display showing the value of the expression Illegal HTML tag removed : expr. The optional parts have the following meaning:
clustered- If given, the new display is created in a cluster. See Clustering, for a discussion.
at (Illegal HTML tag removed : x
,Illegal HTML tag removed : y
)If given, the new display is created at the position (
Illegal HTML tag removed : x
,
Illegal HTML tag removed : y
). Otherwise, a default position is assigned.
dependent onIllegal HTML tag removed : display
If given, an edge from the display numbered or named display to the new display is created. Otherwise, no edge is created. See Dependent Values, for details.
when inIllegal HTML tag removed : scope
now or when inIllegal HTML tag removed : scope
If
when inis given, the display creation isIllegal HTML tag removed : deferred
until execution reaches the given
Illegal HTML tag removed : scope
(a function name, as in the backtrace output).
If
now or when inis given, DDD first attempts to create the display immediately. The display is deferred only if display creation fails.If neither
when insuffix nornow or when insuffix is given, the display is created immediately.
Node:Selecting Displays, Next:Showing and Hiding Details, Previous:Creating Single Displays, Up:Display Basics
Selecting Displays
Each display in the data window has a title bar containing the display number and the displayed expression (the display name). Below the title, the display value is shown.
You can select single displays by clicking on them with mouse button 1.
You can extend an existing selection by pressing the <Shift> key while selecting. You can also toggle an existing selection by pressing the <Shift> key while selecting already selected displays.
Single displays may also be selected by using the arrow keys <Up>, <Down>, <Left>, and <Right>.
Multiple displays are selected by pressing and holding mouse button 1 somewhere on the window background. By moving the pointer while holding the button, a selection rectangle is shown; all displays fitting in the rectangle are selected when mouse button 1 is released.
If the <Shift> key is pressed while selecting, the existing selection is extended.
By double-clicking on a display title, the display itself and all connected displays are automatically selected.

Node:Showing and Hiding Details, Next:Rotating Displays, Previous:Selecting Displays, Up:Display Basics
Showing and Hiding Details
Aggregate values (i.e. records, structs, classes, and arrays) can be shown expanded, that is, displaying all details, or hidden, that is, displayed as {...}.
To show details about an aggregate, select the aggregate by clicking mouse button 1 on its name or value and click on the Show button. Details are shown for the aggregate itself as well as for all contained sub-aggregates.
To hide details about an aggregate, select the aggregate by clicking mouse button 1 on its name or value and click on the Hide button.

When pressing and holding mouse button 1 on the Show/Hide button, a menu pops up with even more alternatives:
Show More ()- Shows details of all aggregates currently hidden, but not of their sub-aggregates. You can invoke this item several times in a row to reveal more and more details of the selected aggregate.
Show Just ()- Shows details of the selected aggregate, but hides all sub-aggregates.
Show All ()- Shows all details of the selected aggregate and of its sub-aggregates. This item is equivalent to the
Showbutton. Hide ()- Hide all details of the selected aggregate. This item is equivalent to the
Hidebutton.
As a faster alternative, you can also press mouse button 3 on the aggregate and select the appropriate menu item.
As an even faster alternative, you can also double-click mouse button 1 on a value. If some part of the value is hidden, more details will be shown; if the entire value is shown, double-clicking will hide the value instead. This way, you can double-click on a value until you get the right amount of details.
If all details of a display are hidden, the display is called Illegal HTML tag removed : disabled; this is indicated by the string (Disabled).
Displays can also be disabled or enabled via a DDD command, which you enter at the debugger prompt:
     graph disable display

**Illegal HTML tag removed :** displays...
disables the given displays.
     graph enable display

**Illegal HTML tag removed :** displays...
re-enables the given displays.
In both commands, Illegal HTML tag removed : displays... is either
- a space-separated list of display numbers to disable or enable, or
- a single display name. If you specify a display by name, all displays with this name will be affected.
Use Edit => Undo to undo disabling or enabling displays.
Node:Rotating Displays, Next:Displaying Local Variables, Previous:Showing and Hiding Details, Up:Display Basics
Rotating Displays
Arrays, structures and lists can be oriented horizontally or vertically. To change the orientation of a display, select it and then click on the Rotate button.
As a faster alternative, you can also press mouse button 3 on the array and select Rotate from the popup menu.

If a structure or list is oriented horizontally, DDD automatically suppresses the member names. This can be handy for saving space.
The last chosen display orientation is used for the creation of new displays. If you recently rotated an array to horizontal orientation, the next array you create will also be oriented horizontally. These settings are tied to the following resources:
| arrayOrientation(class Orientation) | Resource |
|---|---|
How arrays are to be oriented. Possible values are XmVERTICAL (default) and XmHORIZONTAL. |
|---|
| showMemberNames(class ShowMemberNames) | Resource |
|---|---|
Whether to show struct member names or not. Default is on. |
|---|
| structOrientation(class Orientation) | Resource |
|---|---|
How structs are to be oriented. Possible values are XmVERTICAL (default) and XmHORIZONTAL. |
|---|
Node:Displaying Local Variables, Next:Displaying Program Status, Previous:Rotating Displays, Up:Display Basics
Displaying Local Variables
You can display all local variables at once by choosing Data => Display Local Variables. When using DBX, XDB, JDB, or Perl, this displays all local variables, including the arguments of the current function. When using GDB or PYDB, function arguments are contained in a separate display, activated by Data => Display Arguments.
The display showing the local variables can be manipulated just like any other data display. Individual variables can be selected and dereferenced.

Node:Displaying Program Status, Next:Refreshing the Data Window, Previous:Displaying Local Variables, Up:Display Basics
Displaying Program Status
You can create a display from the output of an arbitrary debugger command. By entering
     graph display `

**Illegal HTML tag removed :** command

`
the output of Illegal HTML tag removed : command is turned into a status display updated each time the program stops.
For instance, the command
graph display `where`
creates a status display named Where that shows the current backtrace.
If you are using GDB, DDD provides a panel from which you can choose useful status displays. Select Data => Status Displays and pick your choice from the list.

Refreshing status displays at each stop takes time; you should delete status displays as soon as you don't need them any more.
Node:Refreshing the Data Window, Next:Placement, Previous:Displaying Program Status, Up:Display Basics
Refreshing the Data Window
The data window is automatically updated or Illegal HTML tag removed : refreshed each time the program stops. Values that have changed since the last refresh are highlighted.
However, there may be situations where you should refresh the data window explicitly. This is especially the case whenever you changed debugger settings that could affect the data format, and want the data window to reflect these settings.
You can refresh the data window by selecting Data => Refresh Displays.
As an alternative, you can press mouse button 3 on the background of the data window and select the Refresh Displays item.
Typing
graph refresh
at the debugger prompt has the same effect.
Node:Placement, Next:Clustering, Previous:Refreshing the Data Window, Up:Display Basics
Display Placement
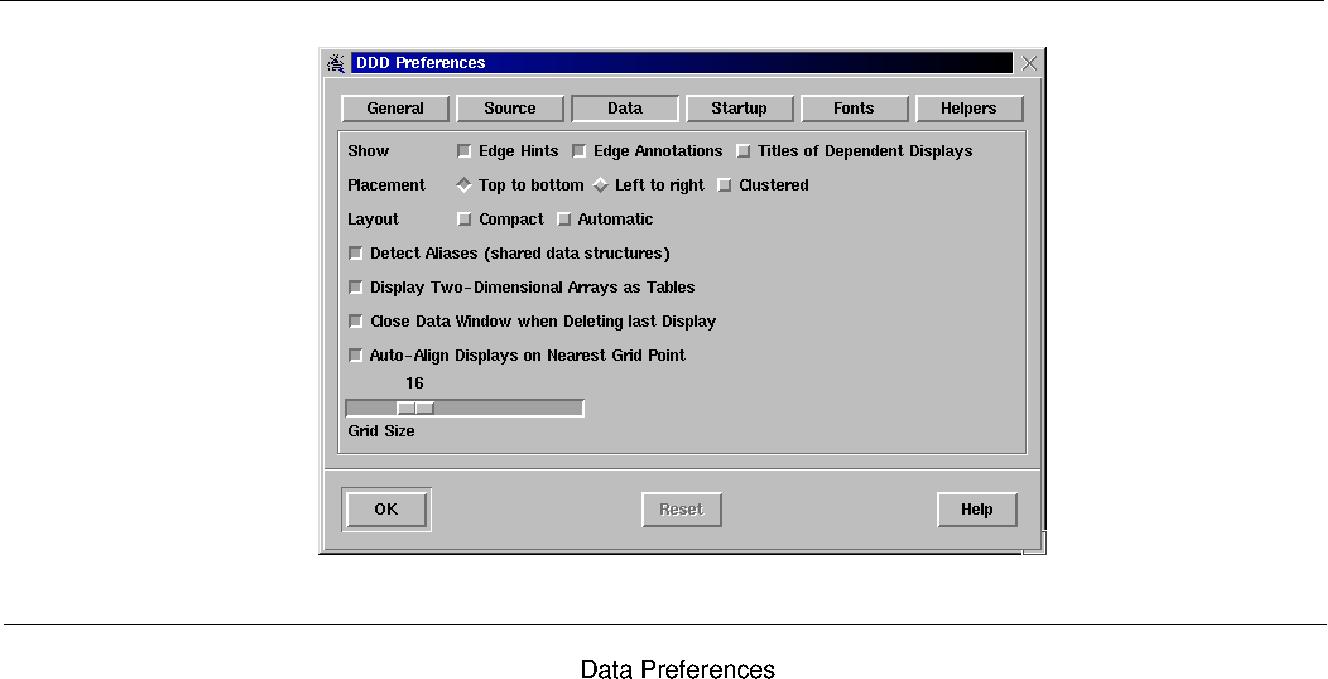
By default, displays are created from top to bottom--that is, each new display is placed below the downmost one. You can change this setting to left to right via Edit => Preferences => Data => Placement => Left to right.
This setting is tied to the following resource:
| displayPlacement(class Orientation) | Resource |
|---|---|
If this is XmVERTICAL (default), DDD places each new independent display below the downmost one. If this is XmHORIZONTAL, each new independent display is placed on the right of the rightmost one. |
|---|
Note that changing the placement of new displays also affects the placement of dependent displays (see Dependent Values). In top to bottom mode, dependent displays are created on the right of the originating display; in left to right mode, dependent displays are created on the below the originating display.
Node:Clustering, Next:Creating Multiple Displays, Previous:Placement, Up:Display Basics
Clustering Displays
If you examine several variables at once, having a separate display for each of them uses a lot of screen space. This is why DDD supports Illegal HTML tag removed : clusters. A cluster merges several logical data displays into one physical display, saving screen space.
There are two ways to create clusters:
- You can create clusters manually. This is done by selecting the displays to be clustered and choosing
Undisp => Cluster (). This creates a new cluster from all selected displays. If an already existing cluster is selected, too, the selected displays will be clustered into the selected cluster. - You can create a cluster automatically for all independent data displays, such that all new data displays will automatically be clustered, too. This is achieved by enabling
Edit => Preferences => Data => Placement => clustered.

Displays in a cluster can be selected and manipulated like parts of an ordinary display; in particular, you can show and hide details, or dereference pointers. However, edges leading to clustered displays can not be shown, and you must either select one or all clustered displays.
Disabling a cluster is called unclustering, and again, there are two ways of doing it:
- You can uncluster displays manually, by selecting the cluster and choosing
Undisp => Uncluster (). - You can uncluster all current and future displays by disabling
Edit => Preferences => Data => Placement => clustered.
Node:Creating Multiple Displays, Next:Editing all Displays, Previous:Clustering, Up:Display Basics
Creating Multiple Displays
To display several successive objects of the same type (a section of an array, or an array of dynamically determined size), you can use the notation Illegal HTML tag removed : from..Illegal HTML tag removed : to in display expressions.
Illegal HTML tag removed : from and Illegal HTML tag removed : to are numbers that denote the first and last expression to display. Thus,
graph display argv[0..9]
creates 10 new displays for argv[0], argv[1], ..., argv[9]. The displays are clustered automatically (see Clustering), such that you can easily handle the set just like an array.
The Illegal HTML tag removed : from..Illegal HTML tag removed : to notation can also be used multiple times. For instance,
graph display 1..5 * 1..5
creates a handy small multiplication table.
The Illegal HTML tag removed : from..Illegal HTML tag removed : to notation creates several displays, which takes time to create and update. If you want to display only a part of an array, array slices are a more efficient way. See Array Slices, for a discussion.
Node:Editing all Displays, Next:Deleting Displays, Previous:Creating Multiple Displays, Up:Display Basics
Editing all Displays
You can view the state of all displays by selecting Data => Displays. This invokes the Illegal HTML tag removed : Display Editor.

The Display Editor shows the properties of each display, using the following fields:
Num- The display number.
Expression- The displayed expression.
StateOne of
enabled- Normal state.
disabled- Disabled; all details are hidden. Use
Showto enable. not active- Out of scope.
deferred- Will be created as soon as its
Scopeis reached (see Creating Single Displays). clustered- Part of a cluster (see Clustering). Use
Undisp => Unclusterto uncluster. alias ofIllegal HTML tag removed : display
A suppressed alias of display
Illegal HTML tag removed : display
(see Shared Structures).
ScopeThe scope in which the display was created. For deferred displays, this is the scope in which the display will be created.Address* The address of the displayed expression. Used for resolving aliases (see Shared Structures).
Node:Deleting Displays, Previous:Editing all Displays, Up:Display Basics
Deleting Displays
To delete a single display, select its title or value and click on the Undisp button. As an alternative, you can also press mouse button 3 on the display and select the Undisplay item.
When a display is deleted, its immediate ancestors and descendants are automatically selected, so that you can easily delete entire graphs.
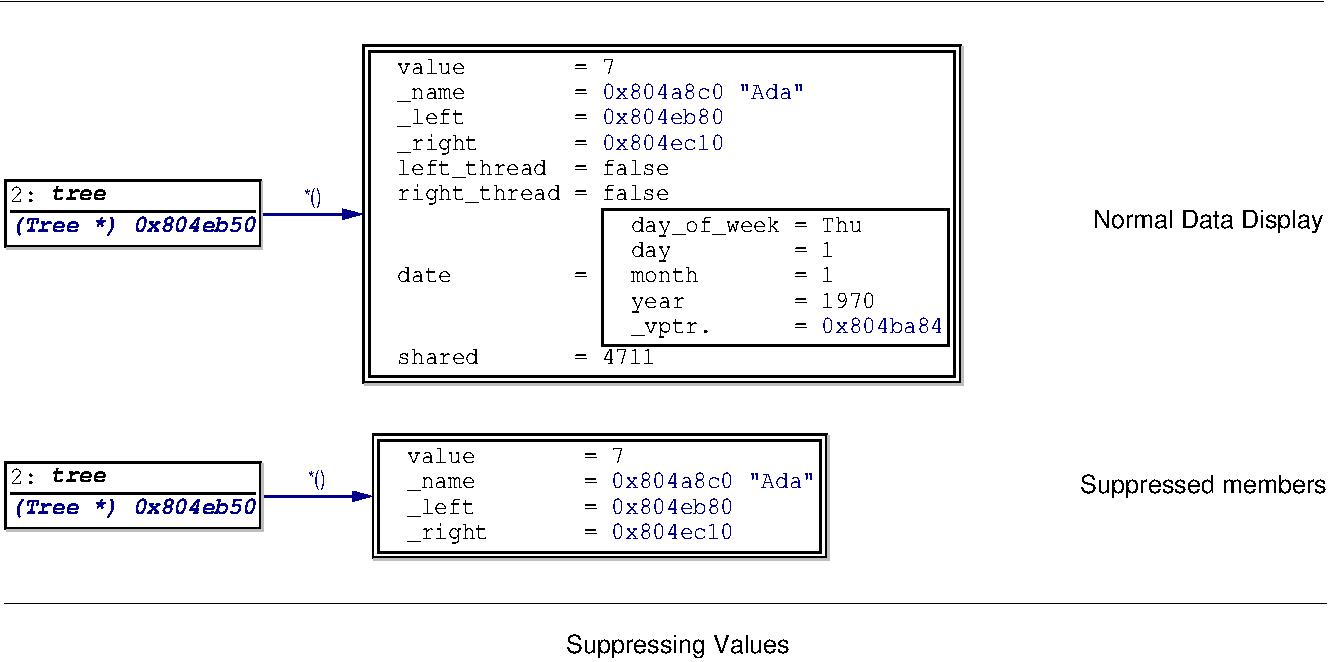
If you have selected only part of a display, clicking on the Undisp button allows you to suppress this part--by applying the Suppress Values theme on the part. You'll be asked for confirmation first. See Using Data Themes, for details.
To delete several displays at once, use the Undisp button in the Display Editor (invoked via Data => Displays). Select any number of display items in the usual way and delete them by pressing Undisp.
As an alternative, you can also use a DDD command:
     graph undisplay

**Illegal HTML tag removed :** displays...
Here, Illegal HTML tag removed : displays... is either
- a space-separated list of display numbers to disable or enable, or
- a single display name. If you specify a display by name, all displays with this name will be affected.
If you are using stacked windows, deleting the last display from the data window also automatically closes the data window. (You can change this via Edit => Preferences => Data => Close data window when deleting last display.)
If you deleted a display by mistake, use Edit => Undo to re-create it.
Finally, you can also cut, copy, and paste displays using the Cut, Copy, and Paste items from the Edit menu. The clipboard holds the commands used to create the displays; Paste inserts the display commands in the debugger console. This allows you to save displays for later usage or to copy displays across multiple DDD instances.
Node:Arrays, Next:Assignment, Previous:Display Basics, Up:Displaying Values
Arrays
DDD has some special features that facilitate handling of arrays.
Array Slices: Displaying
Illegal HTML tag removed : from
..
Illegal HTML tag removed : to
parts of an array
- Repeated Values: How repeated values are handled.
- Arrays as Tables: Displaying two-dimensional arrays.
Node:Array Slices, Next:Repeated Values, Up:Arrays
Array Slices
It is often useful to print out several successive objects of the same type in memory; a Illegal HTML tag removed : slice (section) of an array, or an array of dynamically determined size for which only a pointer exists in the program.
Using DDD, you can display slices using the Illegal HTML tag removed : from..Illegal HTML tag removed : to notation (see Creating Multiple Displays). But this requires that you already know Illegal HTML tag removed : from and Illegal HTML tag removed : to; it is also inefficient to create several single displays. If you use GDB, you have yet another alternative.
Using GDB, you can display successive objects by referring to a contiguous span of memory as an Illegal HTML tag removed : artificial array, using the binary operator @. The left operand of @ should be the first element of the desired array and be an individual object. The right operand should be the desired length of the array. The result is an array value whose elements are all of the type of the left argument. The first element is actually the left argument; the second element comes from bytes of memory immediately following those that hold the first element, and so on.
Here is an example. If a program says
int *array = (int *) malloc (len * sizeof (int));
you can print the contents of array with
print array[0]@len
and display the contents with
graph display array[0]@len
The general form of displaying an array slice is thus
     graph display

**Illegal HTML tag removed :** array

[

**Illegal HTML tag removed :** first

]@

**Illegal HTML tag removed :** nelems
where Illegal HTML tag removed : array is the name of the array to display, Illegal HTML tag removed : first is the index of the first element, and Illegal HTML tag removed : nelems is the number of elements to display.
The left operand of @ must reside in memory. Array values made with @ in this way behave just like other arrays in terms of subscripting, and are coerced to pointers when used in expressions.
Node:Repeated Values, Next:Arrays as Tables, Previous:Array Slices, Up:Arrays
Repeated Values
Using GDB, an array value that is repeated 10 or more times is displayed only once. The value is shown with a <Illegal HTML tag removed : nx> postfix added, where Illegal HTML tag removed : n is the number of times the value is repeated. Thus, the display 0x0 <30x> stands for 30 array elements, each with the value 0x0. This saves a lot of display space, especially with homogeneous arrays.

The default GDB threshold for repeated array values is 10. You can change it via Edit => GDB Settings => Threshold for repeated print elements. Setting the threshold to 0 will cause GDB (and DDD) to display each array element individually. Be sure to refresh the data window via Data => Refresh Displays after a change in GDB settings.
You can also configure DDD to display each array element individually:
| expandRepeatedValues(class ExpandRepeatedValues) | Resource |
|---|---|
| Illegal HTML tag removed : value |
|---|
Node:Arrays as Tables, Previous:Repeated Values, Up:Arrays
Arrays as Tables
By default, DDD lays out two-dimensional arrays as tables, such that all array elements are aligned with each other.27 To disable this feature, unset Edit => Preferences => Data => Display Two-Dimensional Arrays as Tables. This is tied to the following resource:
| align2dArrays(class Align2dArrays) | Resource |
|---|---|
If on (default), DDD lays out two-dimensional arrays as tables, such that all array elements are aligned with each other. If off, DDD treats a two-dimensional array as an array of one-dimensional arrays, each aligned on its own. |
|---|
Node:Assignment, Next:Examining Structures, Previous:Arrays, Up:Displaying Values
Assignment to Variables
During program execution, you can change the values of arbitrary variables.28
To change the value of a variable, enter its name in ()--for instance, by selecting an occurrence or a display. Then, click on the Set button. In a dialog, you can edit the variable value at will; clicking the OK or Apply button commits your change and assigns the new value to the variable.

To change a displayed value, you can also select Set Value menu from the data popup menu,
If you made a mistake, you can use Edit => Undo to re-set the variable to its previous value.
Node:Examining Structures, Next:Customizing Displays, Previous:Assignment, Up:Displaying Values
Examining Structures
Besides displaying simple values, DDD can also visualize the Illegal HTML tag removed : Dependencies between values--especially pointers and other references that make up complex data structures.
- Dependent Values: Edges from values to values.
- Dereferencing Pointers: Examining pointer-based data structures.
- Shared Structures: Multiple pointers to one display.
- Display Shortcuts: Customize your own menus.
Node:Dependent Values, Next:Dereferencing Pointers, Up:Examining Structures
Displaying Dependent Values
Dependent displays are created from an existing display. The dependency is indicated by an Illegal HTML tag removed : edge leading from the originating display to the dependent display.
To create a dependent display, select the originating display or display part and enter the dependent expression in the (): argument field. Then click on the Display button.
Using dependent displays, you can investigate the data structure of a tree for example and lay it out according to your intuitive image of the tree data structure.
By default, DDD does not recognize shared data structures (i.e. a data object referenced by multiple other data objects). See Shared Structures, for details on how to examine such structures.
Node:Dereferencing Pointers, Next:Shared Structures, Previous:Dependent Values, Up:Examining Structures
Dereferencing Pointers
There are special shortcuts for creating dependent displays showing the value of a dereferenced pointer. This allows for rapid examination of pointer-based data structures.
To dereference a pointer, select the originating pointer value or name and click on the Disp * button. A new display showing the dereferenced pointer value is created.
As a faster alternative, you can also press mouse button 3 on the originating pointer value or name and select the Display * menu item.
As an even faster alternative, you can also double-click mouse button 1 on the originating pointer value or name. If you press <Ctrl> while double-clicking, the display will be dereferenced in place-that is, it will be replaced by the dereferenced display.
The Display *() function is also accessible by pressing and holding the Display button.
Node:Shared Structures, Next:Display Shortcuts, Previous:Dereferencing Pointers, Up:Examining Structures
Shared Structures
By default, DDD does not recognize shared data structures--that is, a data object referenced by multiple other data objects. For instance, if two pointers p1 and p2 point at the same data object d, the data displays d, *p1, and *p2 will be separate, although they denote the same object.
DDD provides a special mode which makes it detect these situations. DDD recognizes if two or more data displays are stored at the same physical address, and if this is so, merges all these Illegal HTML tag removed : aliases into one single data display, the original data display. This mode is called Alias Detection; it is enabled via Data => Detect Aliases.
When alias detection is enabled, DDD inquires the memory location (the address) of each data display after each program step. If two displays have the same address, they are merged into one. More specifically, only the one which has least recently changed remains (the original data display); all other aliases are suppressed, i.e. completely hidden. The edges leading to the aliases are replaced by edges leading to the original data display.
An edge created by alias detection is somewhat special: rather than connecting two displays directly, it goes through an Illegal HTML tag removed : edge hint, describing an arc connecting the two displays and the edge hint.
Each edge hint is a placeholder for a suppressed alias; selecting an edge hint is equivalent to selecting the alias. This way, you can easily delete display aliases by simply selecting the edge hint and clicking on Undisp.

To access suppressed display aliases, you can also use the Display Editor. Suppressed displays are listed in the Display Editor as aliases of the original data display. Via the Display Editor, you can select, change, and delete suppressed displays.
Suppressed displays become visible again as soon as
- alias detection is disabled,
- their address changes such that they are no more aliases, or
- the original data display is deleted, such that the least recently changed alias becomes the new original data display.
Please note the following caveats with alias detection:
- Alias detection requires that the current programming language provides a means to determine the address of an arbitrary data object. Currently, only C, C++, and Java are supported.
Some inferior debuggers (for instance, SunOS DBX) produce incorrect output for address expressions. Given a pointer
Illegal HTML tag removed : p
, you may verify the correct function of your inferior debugger by comparing the values of
Illegal HTML tag removed : p
and
&Illegal HTML tag removed : p
(unless
Illegal HTML tag removed : p
actually points to itself). You can also examine the data display addresses, as shown in the Display Editor.
- Alias detection slows down DDD slightly, which is why you can turn it off. You may consider to enable it only at need--for instance, while examining some complex data structure--and disable it while examining control flow (i.e., stepping through your program). DDD will automatically restore edges and data displays when switching modes.
Alias detection is controlled by the following resources:
| deleteAliasDisplays(class DeleteAliasDisplays) | Resource |
|---|---|
If this is on (default), the Undisplay () button also deletes all aliases of the selected displays. If this is off, only the selected displays are deleted; the aliases remain, and one of the aliases will be unsuppressed. |
|---|
| detectAliases(class DetectAliases) | Resource |
|---|---|
If on (default), DDD attempts to recognize shared data structures. If off, shared data structures are not recognized. |
|---|
| typedAliases(class TypedAliases) | Resource |
|---|---|
If on (default), DDD requires structural equivalence in order to recognize shared data structures. If this is off, two displays at the same address are considered aliases, regardless of their structure. |
|---|
Node:Display Shortcuts, Previous:Shared Structures, Up:Examining Structures
Display Shortcuts
DDD maintains a shortcut menu of frequently used display expressions. This menu is activated
- by pressing and holding the
Displaybutton, or - by pressing mouse button 3 on some display and selecting
New Display, or - by pressing <Shift> and mouse button 3 on some display.
By default, the shortcut menu contains frequently used base conversions.
The Other entry in the shortcut menu lets you create a new display that extends the shortcut menu.
As an example, assume you have selected a display named date_ptr. Selecting Display => Other pops up a dialog that allows you to enter a new expression to be displayed--for instance, you can cast the display date_ptr to a new display (char *)date_ptr. If the Include in New Display Menu toggle was activated, the shortcut menu will then contain a new entry Display (char *)() that will cast any selected display Illegal HTML tag removed : display to (char *)Illegal HTML tag removed : display. Such shortcuts can save you a lot of time when examining complex data structures.

You can edit the contents of the New Display menu by selecting its Edit Menu item. This pops up the Shortcut Editor containing all shortcut expressions, which you can edit at leisure. Each line contains the expression for exactly one menu item. Clicking on Apply re-creates the New Display menu from the text. If the text is empty, the New Display menu will be empty, too.

DDD also allows you to specify individual labels for user-defined buttons. You can write such a label after the expression, separated by //. This feature is used in the default contents of the GDB New Display menu, where each of the base conversions has a label:
     /t ()   // Convert to Bin
     /d ()   // Convert to Dec
     /x ()   // Convert to Hex
     /o ()   // Convert to Oct
Feel free to add other conversions here. DDD supports up to 20 New Display menu items.
The shortcut menu is controlled by the following resources:
| dbxDisplayShortcuts(class DisplayShortcuts) | Resource |
|---|---|
If a line contains a label delimiter29, the string before the delimiter is used as Illegal HTML tag removed : expression, and the string after the delimiter is used as label. Otherwise, the label is Display Illegal HTML tag removed : expression. Upon activation, the string () in Illegal HTML tag removed : expression is replaced by the name of the currently selected display. |
|---|
| gdbDisplayShortcuts(class DisplayShortcuts) | Resource |
|---|---|
A newline-separated list of display expressions to be included in the New Display menu for GDB. See the description of dbxDisplayShortcuts, above. |
|---|
| jdbDisplayShortcuts(class DisplayShortcuts) | Resource |
|---|---|
A newline-separated list of display expressions to be included in the New Display menu for JDB. See the description of dbxDisplayShortcuts, above. |
|---|
| perlDisplayShortcuts(class DisplayShortcuts) | Resource |
|---|---|
A newline-separated list of display expressions to be included in the New Display menu for Perl. See the description of dbxDisplayShortcuts, above. |
|---|
| bashDisplayShortcuts(class DisplayShortcuts) | Resource |
|---|---|
A newline-separated list of display expressions to be included in the New Display menu for Bash. See the description of dbxDisplayShortcuts, above. |
|---|
| pydbDisplayShortcuts(class DisplayShortcuts) | Resource |
|---|---|
A newline-separated list of display expressions to be included in the New Display menu for PYDB. See the description of dbxDisplayShortcuts, above. |
|---|
| xdbDisplayShortcuts(class DisplayShortcuts) | Resource |
|---|---|
A newline-separated list of display expressions to be included in the New Display menu for XDB. See the description of dbxDisplayShortcuts, above. |
|---|
Node:Customizing Displays, Next:Layouting the Graph, Previous:Examining Structures, Up:Displaying Values
Customizing Displays
- Using Data Themes:
- Applying Data Themes to Several Values:
- Editing Themes:
- Writing Data Themes:
- Display Resources:
- VSL Resources:
Node:Using Data Themes, Next:Applying Data Themes to Several Values, Up:Customizing Displays
Using Data Themes
DDD provides a simple method to customize displays. DDD comes with a number of visual modifiers, called data themes.
Each theme modifies a particular aspect of a data display. It can be applied to individual displays or to a number of displays. The themes installed with DDD include:
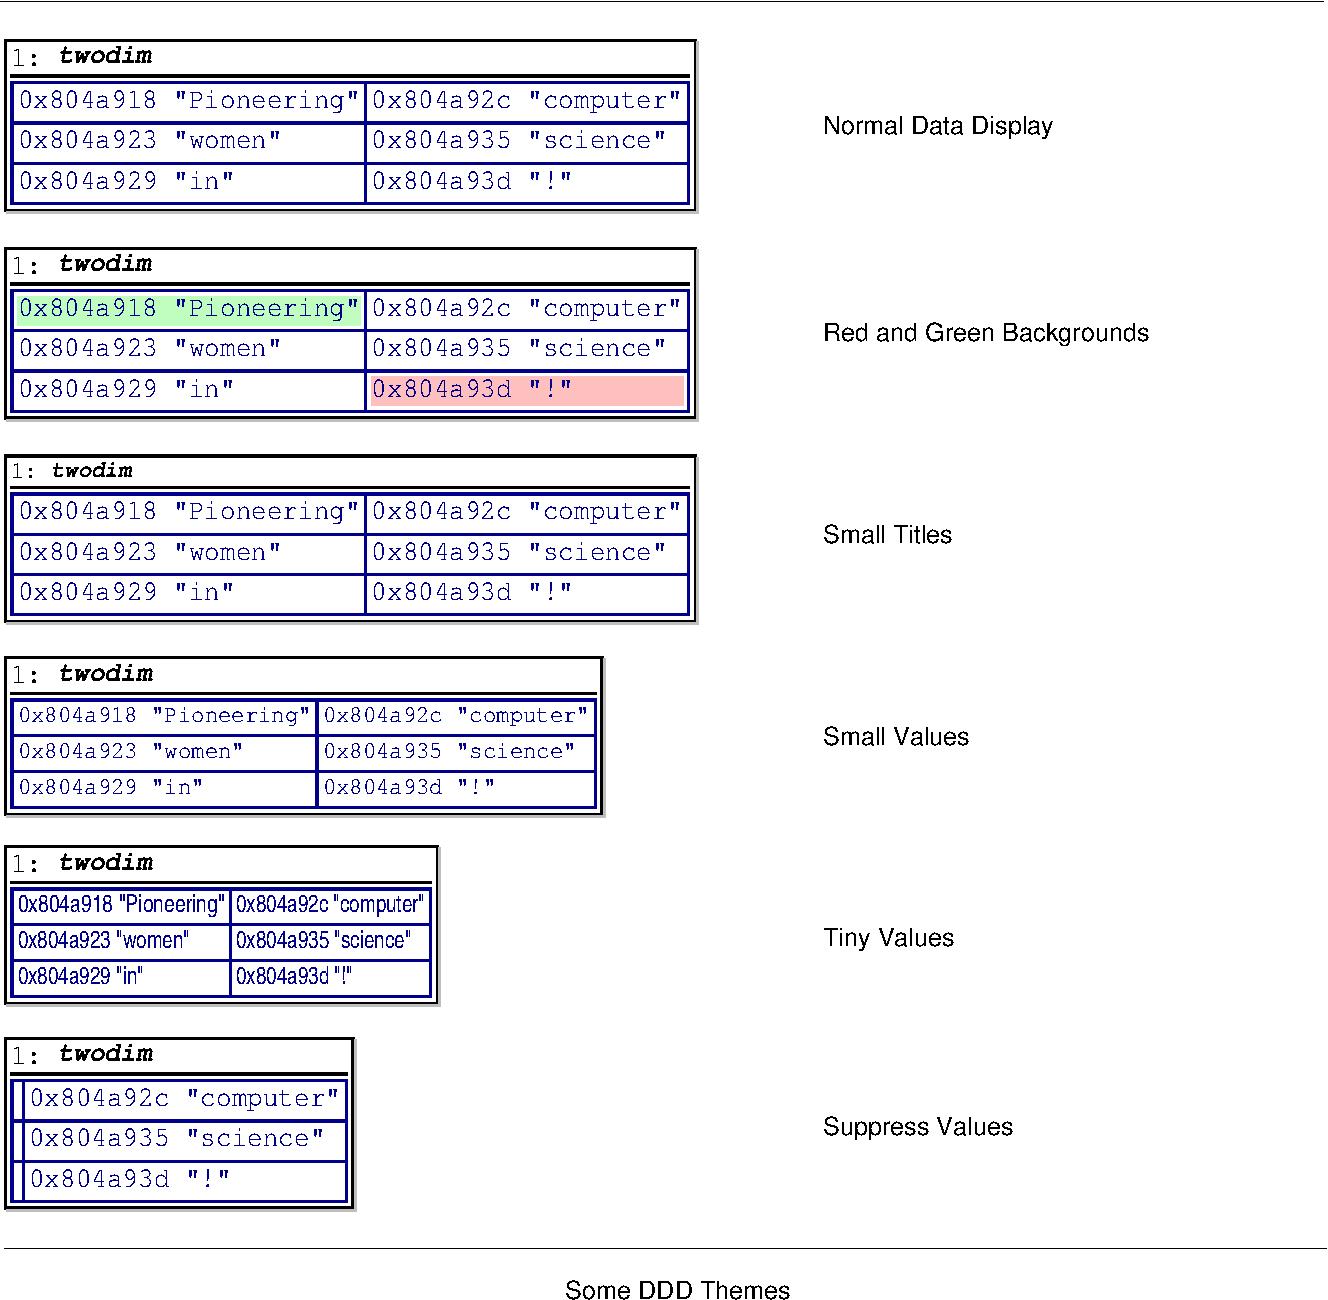
Small Titles- Apply this theme to show display titles in a smaller font.
Small Values- Apply this theme to display values in a smaller font.
Tiny Values- Apply this theme to display values in a tiny font.
Suppress Values- Apply this theme to display values not at all.
Each of these themes can be applied for specific displays.
To apply a theme on a display,
- Press mouse button 3 on the display.
- Select
Theme - Select the theme to apply.
For instance, to display the variable s in a tiny font, click mouse button 3 on the display of s, and select Theme => Tiny Values => Apply.
To unapply a theme, just click on Undo (if you just applied it) or repeat the sequence as above.
Node:Applying Data Themes to Several Values, Next:Editing Themes, Previous:Using Data Themes, Up:Customizing Displays
Applying Data Themes to Several Values
Whenever you want to apply a theme on a struct member or an array element, you will be asked whether to
- apply the theme on the single value only, or
- apply the theme on all similar values.
Suppose, for instance, that you don't want to see vptr members anymore. Then you'd apply the theme Suppress Values on all similar values.
On the other hand, if you want to highlight one single value only, you'd apply the theme Red Background on only one single value.
If you find this confirmation annoying, you can define a command button which directly applies the theme. See Defining Commands, for details on defining commands.
Applying and unapplying themes is associated with the following commands:
     graph apply theme

**Illegal HTML tag removed :** name

**Illegal HTML tag removed :** pattern
applies the theme Illegal HTML tag removed : name on Illegal HTML tag removed : pattern.
     graph unapply theme

**Illegal HTML tag removed :** name

**Illegal HTML tag removed :** pattern
unapplies the theme Illegal HTML tag removed : name on Illegal HTML tag removed : pattern.
     graph toggle theme

**Illegal HTML tag removed :** name

**Illegal HTML tag removed :** pattern
applies the theme Illegal HTML tag removed : name on Illegal HTML tag removed : pattern if it was not already applied, and unapplies it otherwise.
Node:Editing Themes, Next:Writing Data Themes, Previous:Applying Data Themes to Several Values, Up:Customizing Displays
Editing Themes
Each theme can be globally activated or not. If a theme is activated, it is applied to all expressions that match its pattern.
Normally, these patterns are automatically maintained by simply selecting the themes for the individual displays. However, you can also edit patterns directly.
Patterns are separated by ; and contain shell-like metacharacters:
*matches any sequence of characters.?matches any single character.[Illegal HTML tag removed : set
]matches any character inIllegal HTML tag removed : set
. Character ranges can be expressed using
Illegal HTML tag removed : from
-
Illegal HTML tag removed : to
:
[0-9a-zA-Z_]is the set of characters allowed in C characters.[!Illegal HTML tag removed : set
]matches any character not inIllegal HTML tag removed : set
.
- To suppress the special syntactic significance of any metacharacter\n\ and match the character exactly, precede it with
\(backslash). - To suppress the syntactic significance of all metacharacters,\n\ enclose the pattern in double or single quotes.\n\
To edit the set of themes, invoke Data => Themes.
To apply changes you made to the themes, click on Apply. To revert the themes to the last saved, click on Reset.
Node:Writing Data Themes, Next:Display Resources, Previous:Editing Themes, Up:Customizing Displays
Writing Data Themes
You can write your own data themes, customizing the display to match your need. See Top, for details.
Node:Display Resources, Next:VSL Resources, Previous:Writing Data Themes, Up:Customizing Displays
Display Resources
You can use these resources to control display appearance:
| autoCloseDataWindow(class AutoClose) | Resource |
|---|---|
If this is on (default) and DDD is in stacked window mode, deleting the last display automatically closes the data window. If this is off, the data window stays open even after deleting the last display. |
|---|
| bumpDisplays(class BumpDisplays) | Resource |
|---|---|
| Illegal HTML tag removed : d |
|---|
| clusterDisplays(class ClusterDisplays) | Resource |
|---|---|
If on, new independent data displays will automatically be clustered. Default is off, meaning to leave new displays unclustered. |
|---|
| hideInactiveDisplays(class HideInactiveDisplays) | Resource |
|---|---|
If some display gets out of scope and this resource is on (default), DDD removes it from the data display. If this is off, it is simply disabled. |
|---|
| showBaseDisplayTitles(class ShowDisplayTitles) | Resource |
|---|---|
Whether to assign titles to base (independent) displays or not. Default is on. |
|---|
| showDependentDisplayTitles(class ShowDisplayTitles) | Resource |
|---|---|
Whether to assign titles to dependent displays or not. Default is off. |
|---|
| suppressTheme(class Theme) | Resource |
|---|---|
The theme to apply when selecting Undisp on a data value. Default is suppress.vsl. |
|---|
| themes(class Themes) | Resource |
|---|---|
| Illegal HTML tag removed : name |
|---|
Node:VSL Resources, Previous:Display Resources, Up:Customizing Displays
VSL Resources
The following resources control the VSL interpreter:
| vslBaseDefs(class VSLDefs) | Resource |
|---|---|
A string with additional VSL definitions that are appended to the builtin VSL library. This resource is prepended to the vslDefs resource below and set in the DDD application defaults file; don't change it. |
|---|
| vslDefs(class VSLDefs) | Resource |
|---|---|
| A string with additional VSL definitions that are appended to the builtin VSL library. The default value is an empty string. This resource can be used to override specific VSL definitions that affect the data display. The preferred method, though, is to write a specific data theme (see Writing Data Themes). |
|---|
| vslLibrary(class VSLLibrary) | Resource |
|---|---|
The VSL library to use. builtin (default) means to use the built-in library, any other value is used as file name. |
|---|
| vslPath(class VSLPath) | Resource |
|---|---|
| A colon-separated list of directories to search for VSL include files. The following directory names are special:
- The special directory name
user_themesstands for your individual theme directory, typically~/.ddd/themes/. - The special directory name
ddd_themesstands for the installed theme directory, typically/usr/local/share/ddd-3.3.9/themes/.
Default is user_themes:ddd_themes:., which means that DDD first searches your theme directory, followed by the system directory and the current directory. |
| --- |
If your DDD source distribution is installed in /opt/src, you can use the following settings to read the VSL library from /home/joe/ddd.vsl:
     Ddd*vslLibrary: /home/joe/ddd.vsl
     Ddd*vslPath:    user_themes:.:/opt/src/ddd/ddd:/opt/src/ddd/vsllib
VSL include files referenced by /home/joe/ddd.vsl are searched first in the current directory ., then in your theme directory, then in /opt/src/ddd/ddd/, and then in /opt/src/ddd/vsllib/.
Instead of supplying another VSL library, it is often easier to specify some minor changes to the built-in library (see Writing Data Themes).
Node:Layouting the Graph, Next:Printing the Graph, Previous:Customizing Displays, Up:Displaying Values
Layouting the Graph
If you have several displays at once, you may wish to arrange them according to your personal preferences. This section tells you how you can do this.
- Moving Displays:
- Scrolling Data:
- Aligning Displays:
- Automatic Layout:
- Rotating the Graph:
Node:Moving Displays, Next:Scrolling Data, Up:Layouting the Graph
Moving Displays
From time to time, you may wish to move displays at another place in the data window. You can move a single display by pressing and holding mouse button 1 on the display title. Moving the pointer while holding the button causes all selected displays to move along with the pointer.
Edge hints can be selected and moved around like other displays. If an arc goes through the edge hint, you can change the shape of the arc by moving the edge hint around.
For fine-grain movements, selected displays may also be moved using the arrow keys. Pressing <Shift> and an arrow key moves displays by single pixels. Pressing <Ctrl> and arrow keys moves displays by grid positions.
Node:Scrolling Data, Next:Aligning Displays, Previous:Moving Displays, Up:Layouting the Graph
Scrolling Data
If the data window becomes too small to hold all displays, scroll bars are created. If your DDD is set up to use panners instead, a panner is created in the lower right edge. When the panner is moved around, the window view follows the position of the panner.
To change from scroll bars to panners, use Edit => Startup => Data Scrolling and choose either Panner or Scrollbars.
This setting is tied to the following resource:
| pannedGraphEditor(class PannedGraphEditor) | Resource |
|---|---|
See Options, for the --scrolled-graph-editor and --panned-graph-editor options. |
|---|
Node:Aligning Displays, Next:Automatic Layout, Previous:Scrolling Data, Up:Layouting the Graph
Aligning Displays
You can align all displays on the nearest grid position by selecting Data => Align on Grid. This is useful for keeping edges strictly horizontal or vertical.
You can enforce alignment by selecting Edit => Preferences => Data => Auto-align Displays on Nearest Grid Point. If this feature is enabled, displays can be moved on grid positions only.
Node:Automatic Layout, Next:Rotating the Graph, Previous:Aligning Displays, Up:Layouting the Graph
Automatic Layout
You can layout the entire graph as a tree by selecting Data => Layout Graph. The layout direction is determined from the display placement (see Placement) and from the last rotation (see Rotating the Graph).

Layouting the graph may introduce Illegal HTML tag removed : edge hints; that is, edges are no more straight lines, but lead to an edge hint and from there to their destination. Edge hints can be moved around like arbitrary displays.
To enable a more compact layout, you can set the Edit => Preferences => Data => Compact Layout option. This realizes an alternate layout algorithm, where successors are placed next to their parents. This algorithm is suitable for homogeneous data structures only.
You can enforce layout by setting Edit => Preferences => Data => Automatic Layout. If automatic layout is enabled, the graph is layouted after each change.
Node:Rotating the Graph, Previous:Automatic Layout, Up:Layouting the Graph
Rotating the Graph
You can rotate the entire graph clockwise by 90 degrees by selecting Data => Rotate Graph. You may need to layout the graph after rotating it; See Automatic Layout, for details.
Node:Printing the Graph, Previous:Layouting the Graph, Up:Displaying Values
Printing the Graph
DDD allows for printing the graph picture on PostScript printers or into files. This is useful for documenting program states.

To print the graph on a PostScript printer, select File => Print Graph. Enter the printing command in the Print Command field. Click on the OK or the Apply button to start printing.
As an alternative, you may also print the graph in a file. Click on the File button and enter the file name in the File Name field. Click on the Print button to create the file.
When the graph is printed in a file, two formats are available:
PostScript--suitable for enclosing the graph in another document;FIG--suitable for post-processing, using thexfiggraphic editor, or for conversion into other formats (among others, IBMGL, TeX, PIC), using thetransfigorfig2devprograms.

Please note the following caveats related to printing graphs:
- If any displays were selected when invoking the
Printdialog, the optionSelected Onlyis set. This makes DDD print only the selected displays. - The
Color,Orientation, andPaper Sizeoptions are meaningful for PostScript only.
These settings are tied to the following resources:
| printCommand(class PrintCommand) | Resource |
|---|---|
The command to print a PostScript file. Usually lp or lpr. |
|---|
| paperSize(class PaperSize) | Resource |
|---|---|
| Illegal HTML tag removed : width |
|---|
Node:Plotting Values, Next:Examining Memory, Previous:Displaying Values, Up:Examining Data